When I started as Head Business Analytics and MIS, my first major challenge was to compile and report the daily performance of all our field offices to higher management. This was a critical task that happened every night after business close. The raw data, detailing the daily efforts of our field officials, arrived in various Microsoft Excel files, and the entire process of gathering, consolidating, and presenting this information was done manually. This meant a late-night exercise for me, involving not just data crunching but also converting the final results into three specific formats: an updated Excel sheet, a PDF report, and a quick snapshot image. The nature of this task, happening after hours, made it especially challenging, as I needed a way to perform it remotely, without relying on a specific office computer, and to handle any unforeseen emergencies or access issues. It was clear that I needed to eliminate all the manual drudgery – renaming files, typing in dates, manually capturing snapshots, and even writing the emails to send the reports. This was an extereme automation of a task previously entirely performed manually. I just had to click one button and the work was done.
My initial attempt to automate this process began within the Microsoft ecosystem, where I designed a flow using Power Automate. While it offered some relief from the manual burden, I quickly encountered significant limitations. These included difficulties in handling large volumes of data efficiently, challenges with complex file manipulations, and restrictions on how it could interact with different file types and external services.
The Microsoft solution, though a good starting point, proved insufficient for the level of flexibility, scalability, and robust performance I needed to fully automate this critical, time-sensitive process. This experience made it clear that a more powerful, cloud-based solution was essential to overcome these hurdles and achieve true automation from anywhere.
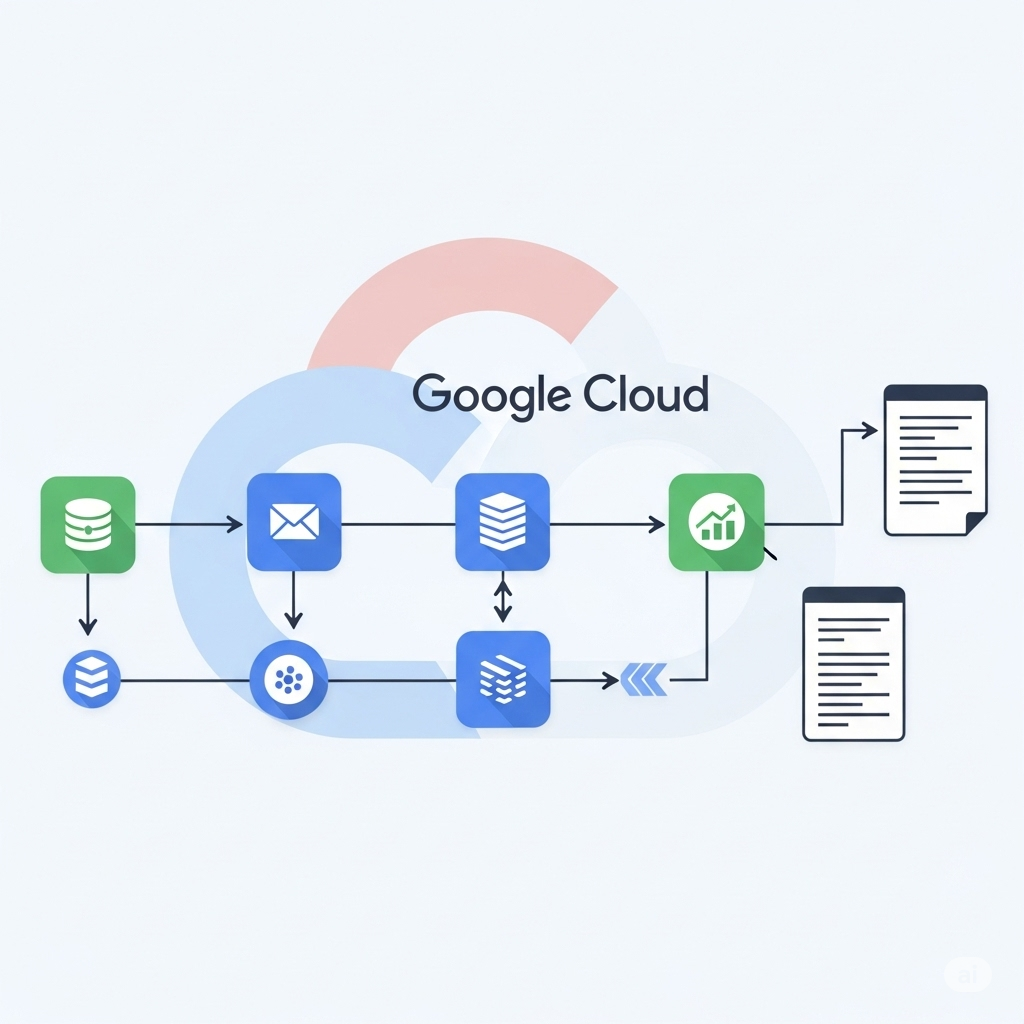
So I switched to Google Clould where I get the support and full power of python. And remember, all those systems where coding is avoided, do come with a price. For that convinience you loose a lot of power and on each step of the automation, you feel like your hand are tied and can be moved only to some extent. An automation solution backed by a programming language, gives you all the power. You can do whatever you want to. So I abandoned the power automate solution and designed this in Google Cloud.
This project is designed to completely automate the daily process of collecting, compiling, and reporting performance data from various field offices, all within the robust environment of Google Cloud. Here’s a step-by-step breakdown of what it does:
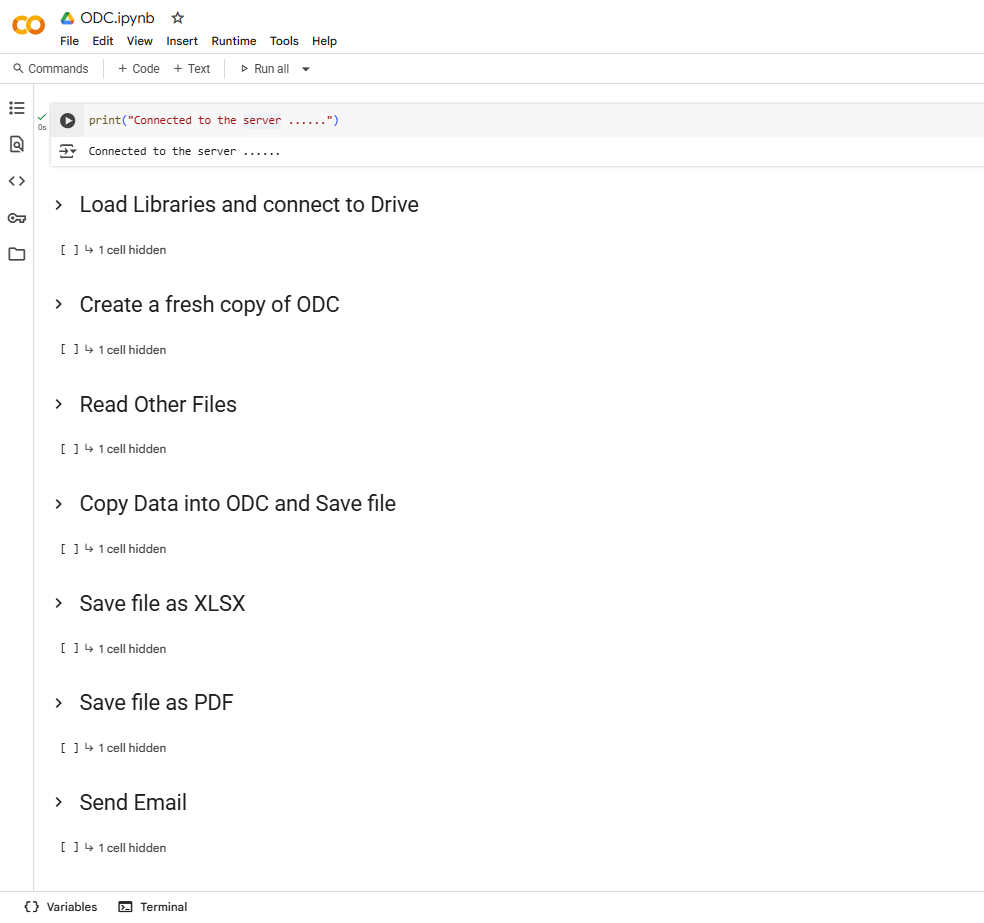
- Connect to Google Cloud: The automation first securely establishes a connection to my Google Cloud environment. This is the foundation, allowing it to access and utilize various Google services like Drive and Sheets.
- Prepare the Master Report: It starts by creating a brand-new copy of the main “ODC” (One Day Change) spreadsheet. This ensures that each day’s report begins fresh, preventing any lingering data from previous days and guaranteeing accuracy. This new copy is automatically named with the current date, keeping everything organized.
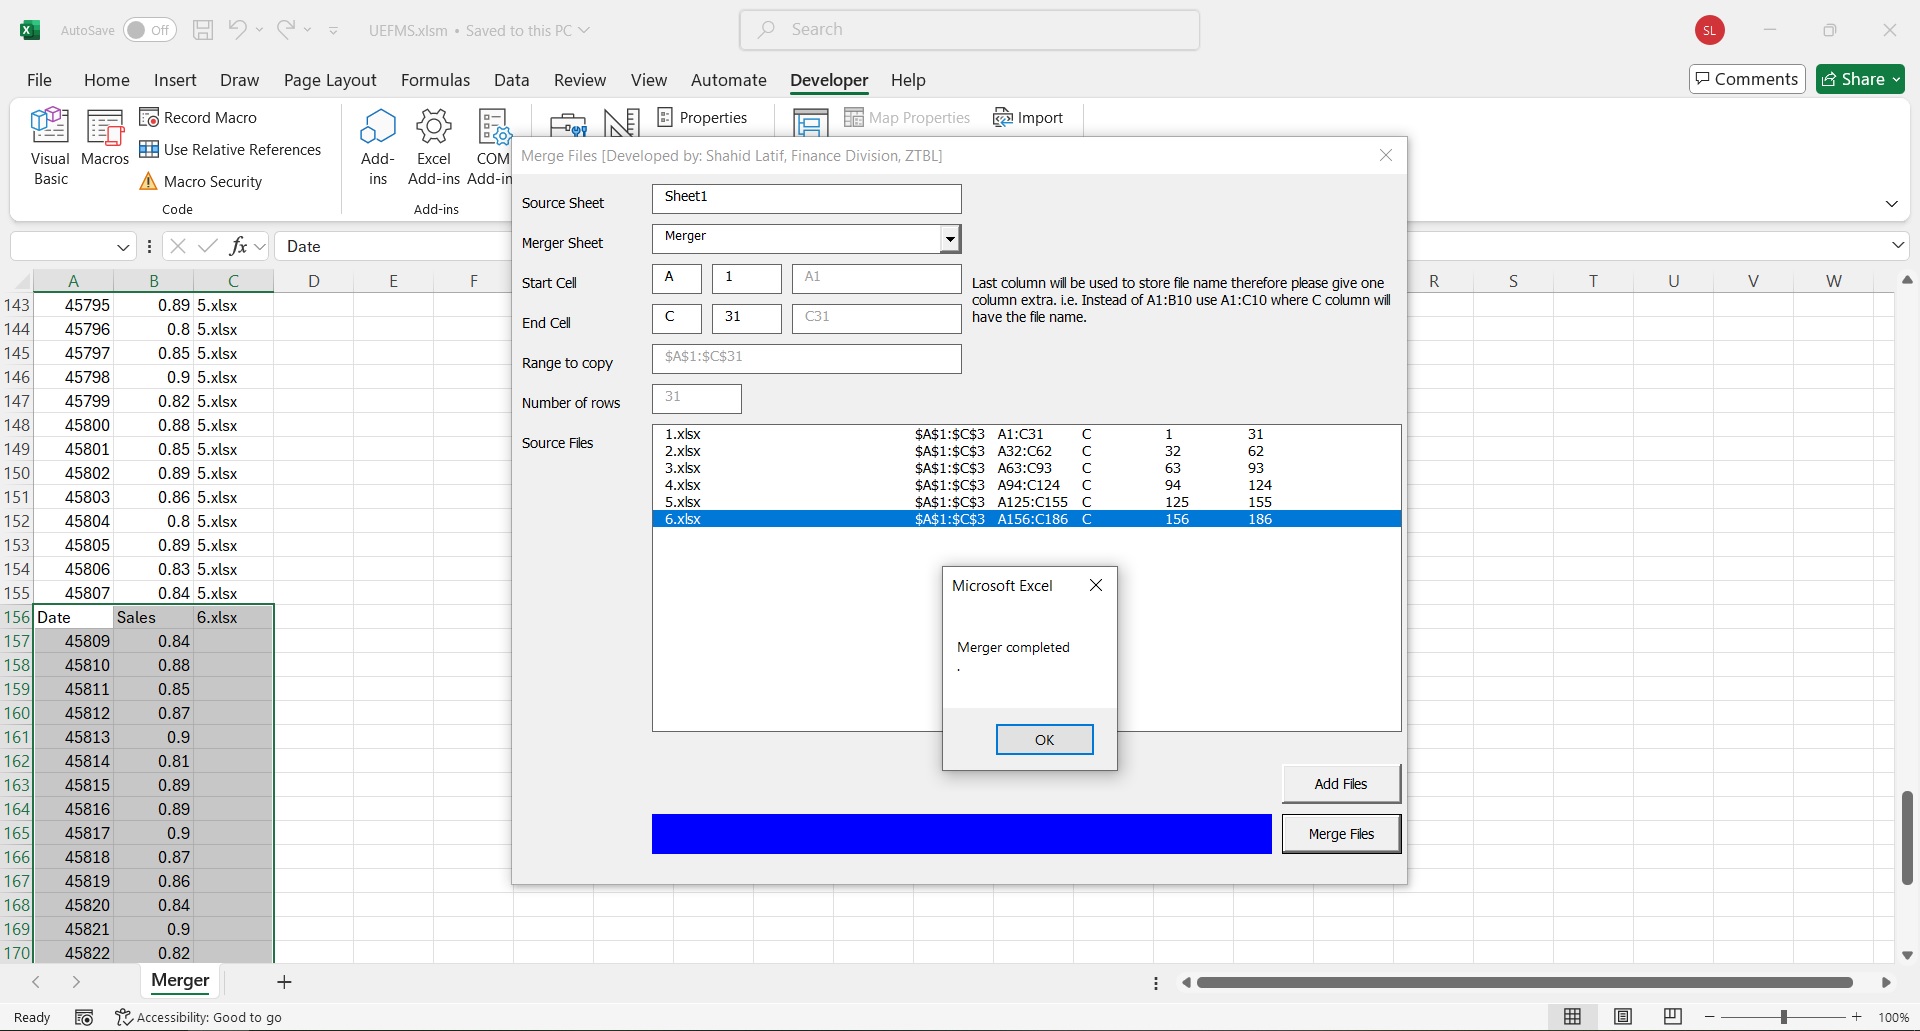
- Gather Regional Data: The system then scans a specific Google Drive folder dedicated to “Regions.” Inside this folder, it identifies all relevant Excel files, which contain the raw daily performance data from each field office.
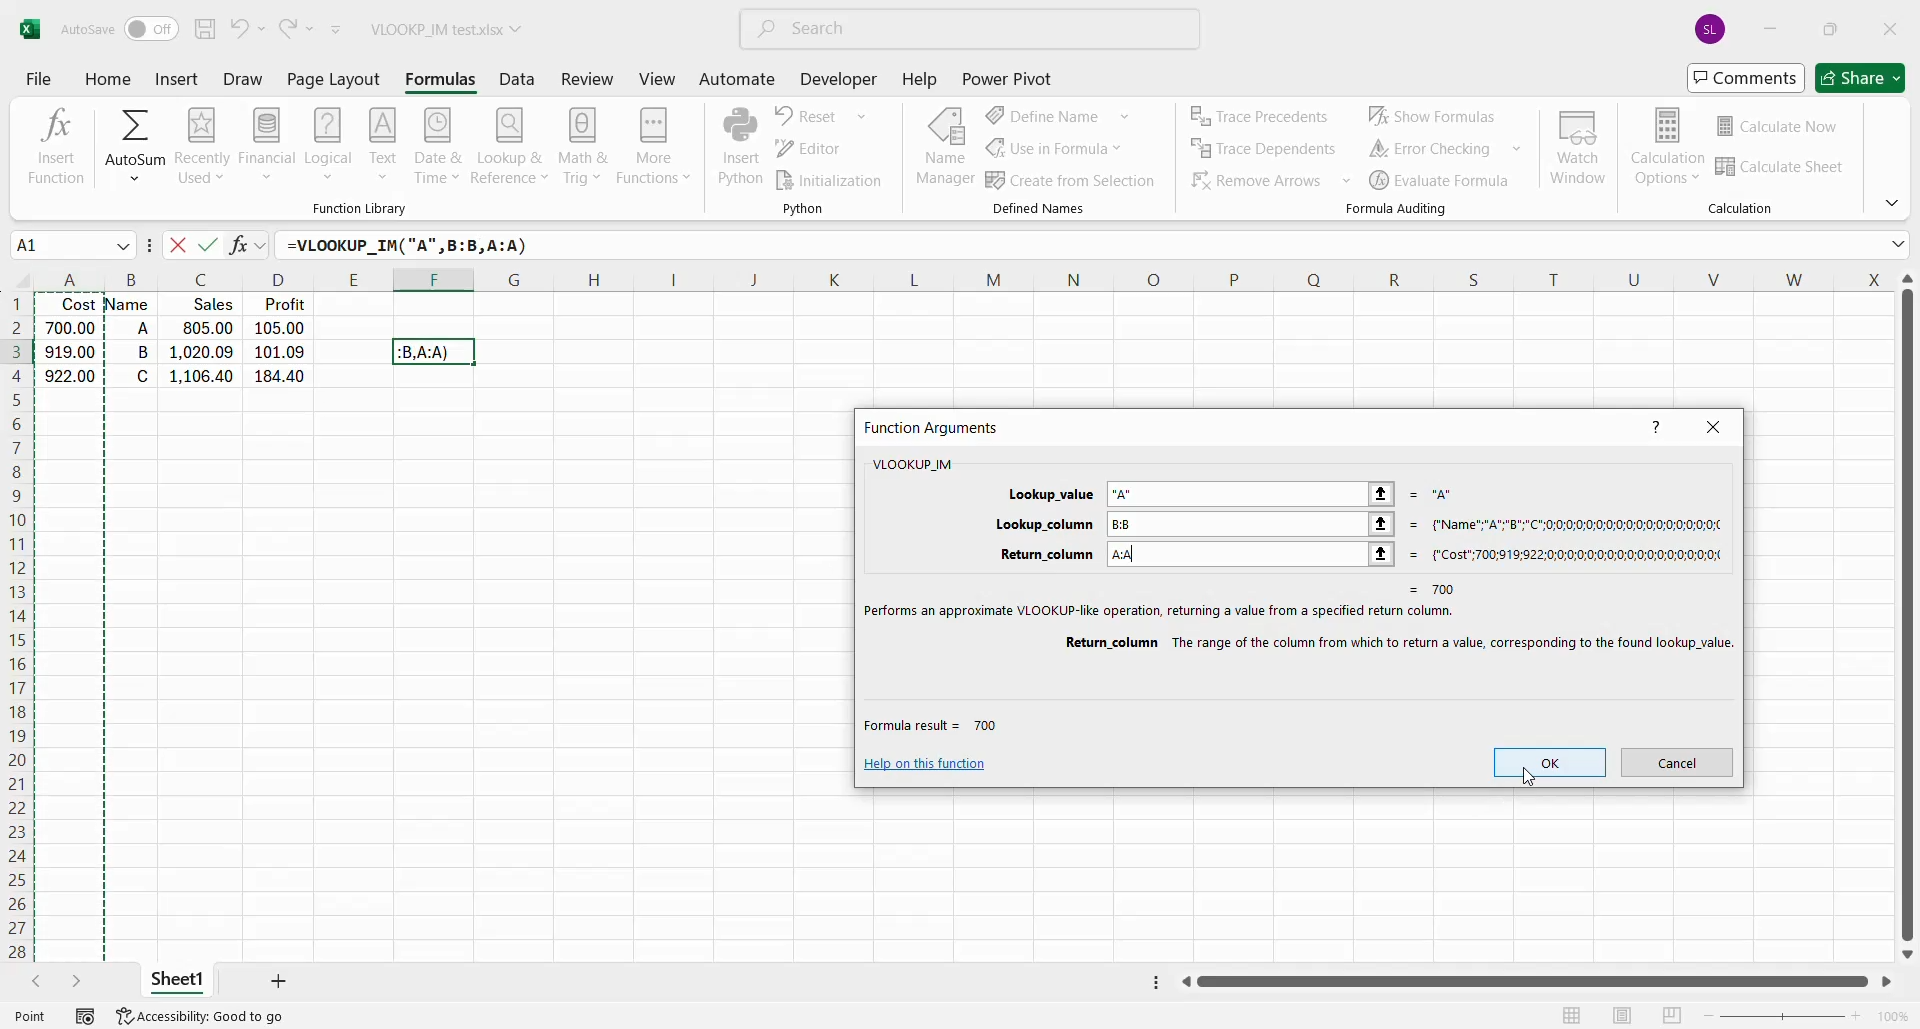
- Extract and Consolidate Data: For each Excel file found, the automation precisely reads a predefined section of the spreadsheet. It extracts only the necessary performance figures, ignoring any irrelevant information. All this extracted data from different regional files is then combined into one large, organized dataset.
- Populate the Master Report: The consolidated data is then seamlessly written into the newly created “ODC” spreadsheet on Google Sheets. This includes updating a specific cell with the current date, marking the report with when it was generated. This step eliminates manual data entry, ensuring consistency and speed.
- Save as XLSX: Once the data is in the Google Sheet, the automation immediately exports this updated report as a standard Excel (.xlsx) file. This file is saved back into a designated folder on Google Drive, ready for easy sharing or further analysis in Excel if needed.
- Save as PDF: In parallel, the same report from Google Sheets is also exported as a Portable Document Format (.pdf) file. This PDF version is also saved to the same Google Drive folder, providing a static, easy-to-view document for various recipients.
- Send Email with Attachments: A critical step is sending out the reports. The automation automatically composes an email, complete with a dynamic subject line (including the current date) and a pre-defined body message. It then attaches both the newly generated XLSX and PDF files to this email and sends it to a specified list of recipients. This ensures timely delivery without any manual email preparation.
- Generate and Save Snapshot: Finally, for quick visual consumption, the automation takes the first page of the generated PDF report, crops it precisely (removing unnecessary margins), and saves it as a clear image (.png) file. This “snapshot” is also stored in the Google Drive folder, offering a quick visual summary of the day’s performance without opening the full reports.